"A picture formed in my mind of an invisible, ethereal, wormhole-style thread binding the two curves. How could we represent the functions so that the "intersection" would be visible?"

This post documents my post-class exploration of that issue.
I'd played around with mappings of the complex plane to itself in the past, but that felt unwieldy and, frankly, it tended to give me headaches.
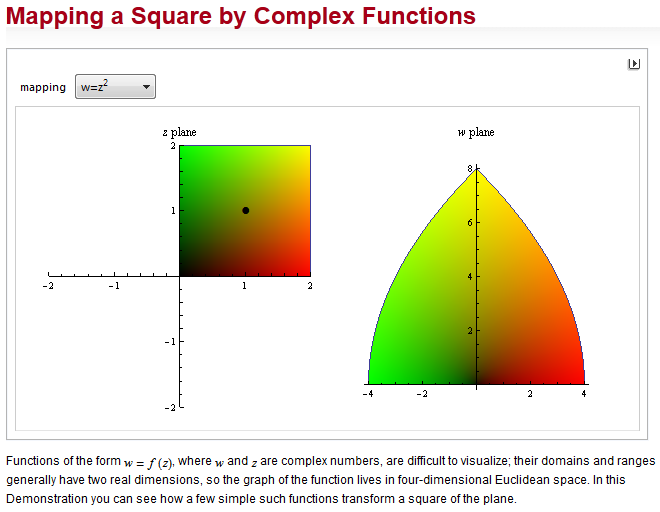 |
| (from Wolfram Demonstrations) |
Note to the reader: To describe my observations with any degree of precision, I'm going to have to use a bit of complex-function notation. Hopefully that doesn't pose too much of a barrier for readers who've not yet had the opportunity to take a course in complex functions. Below, bold variables represent complex numbers (e.g. z = a+bi) or complex-valued functions (e.g. f(z) = ...).
The table I created shows the complex-valued outputs of the function f(z) = (z-3)^2 + 5 over a snippet of a discrete complex plane. The real and imaginary axes are represented in blue.

Here's what I see when I look at the table: I imagine a level curve stretching horizontally across the spreadsheet, exactly one unit above the "floor" (I'll refer to this "glass ceiling" as w = 1). Sort of like this...
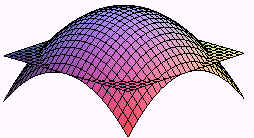
...except in that picture the function values are real numbers. In our case, the function values are complex, which would require a 4-dimensional graph to display, hence my use of a table.
Still, the visualization is helpful to me: it is as if the various function values shown in the table are either "above or below" that glass ceiling (but also "left or right" of it... oh man, here comes those four-dimensional complex-mapping headaches again).
Anyhow, the two solutions to w = f(z) = 1 are easy to pick out in the table (orange cells). We can see that f(z) = 1 at just two points: (3+2i, 1) and (3-2i, 1). These orange "points of intersection" represent the points where the graph of w = f(z) "passes through" the glass ceiling w = 1.
Ah ha! The solution is revealed! But I still don't quite see the connection to this graph. Where's that worm hole I was looking for!?
 |
| Created with Geogebra |
So I kept exploring the table, occasionally stopping to do some complex arithmetic on scratch paper, and more patterns began to emerge.
In particular, I noticed that fixing the real part of the input at 3 and varying the imaginary part (that is, reading up and down the yellow z = 3+bi column in the table) always yielded real-valued function outputs. Substituting points of the form z = 3+bi into f(z) quickly reveals why (try it -- there is no imaginary cross-term when you expand (z - 3)^2). So the significance of the axis of symmetry extends beyond the real-valued function realm; apparently, it has something meaningful to say in the complex function realm as well.
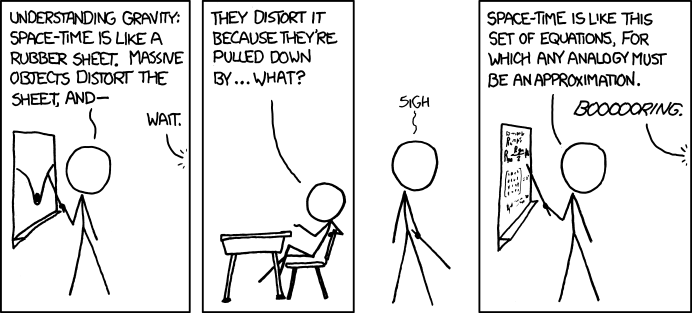
I noticed patterns in the rows, too. Specifically, I noticed that each step up or down the imaginary axis almost acted like a "phase shift" of the function. There, that's starting to have the feel of a space-time wormhole sci-fi connection I was hoping for!
Captain: Why didn't we detect the aliens before?
Science Officer: They were slightly out of phase with our space-time continuum.Let me explain. Look at the yellow row corresponding to z = a+0i (reproduced below).
I've labeled this "no phase shift of f(x)". Because the imaginary part is zero, this row simply represents the table of real-valued ordered pairs (x, f(x)) that might be produced by the TABLE feature on your graphing calculator. Notice the first-differences (measured horizontally from the axis of symmetry) are 1, 3, 5, ... and the second differences are constant (2).
Now shift up one unit on the imaginary axis and examine the yellow row corresponding to z = a+i.
I've labeled this row "+i phase shift". Reading across that row, we see a ... what, a parallel? a similar??.. I'll go with similar... we see a similar parabola with a recognizable pseudo-axis along z = 3+i. The pseudo-vertex for this slice of f(z) is the point (3+i, 4). Do you see the pseudo-symmetry? Notice too the first-differences (measured horizontally from the axis of symmetry) are now 1+2i, 3+2i, 5+2i, ... and the second differences remain constant (and real-valued) at 2.
Yes, I'm using pseudo- to avoid technical matters here. This post is already long enough!
Now shift up again along the imaginary axis to the yellow row labeled "+2i phase shift."
We can see another similar parabola with the same type of pseudo-symmetry along z = 3+2i. The pseudo-vertex for this slice of f(z) is the point (3+2i, 1), which represents one of the two solutions to the original task of solving f(z) = 1. The other solution is, of course, the complex conjugate z = 3-2i, which is also visible in its own row of the original table. Here, the first-differences as we move across the row are 1+4i, 3+4i, 5+4i, ... and still the second differences are constant at 2.
Very cool. It seems the various rows in the table represent small phase shifts from the real-valued realm into the deeper complex realm, and if you shift far enough, the solution we know must exist is eventually revealed. Who knew all those episodes of Star Trek would eventually come in handy?
Still, I wish there was a better way to visualize this than with a discrete table of values. Others have explored this question, but this post is already plenty long, so I'll merely invite you to look here:
 |
| From: http://blog.mrwaddell.net/archives/339 |
And also here:
 |
| From: http://www.math.hmc.edu/funfacts/ffiles/10005.1.shtml |
for some nice discussions that do a fair job of illuminating some more of the underlying mathematics and connections to geometry. I would still love to see a nice concrete visualization of a complex-valued quadratic function that clearly shows where these complex solutions are hiding in the hidden dimensions beyond the real-valued Cartesian coordinate plane.
Any help?
For most first-year students, finding reliable paper writing help is not as simple as it may appear. Only experienced paper helpers are aware of several essential indicators that distinguish a professional writing company from the dozens of amateur websites and high-school authors who could be found on the internet. Our paper help experts can tackle the most difficult tasks at any grade level and custom term paper writing with a team of qualified native-speaking editors and authors. We know how difficult it is to accomplish all responsibilities on time as past students, mainly when producing affordable papers, requiring much effort and expertise.
ReplyDeleteThank you for writing this post, the rest of the site is really great. I always read your blog. You have my great post. Keep up the good and smart writing. Thanks so much for sharing. kwara coe cut off mark for Statistics
ReplyDelete